How SIPs Perform Against Inflation Returns – Mutual Fund SIP Strategies for Long-Term Investors
Educational Article
⚠️ Important Disclaimer Mutual fund investments are subject to market risks, including the possible loss of principal. This article is purely educational and does not constitute investment advice, recommendation, or solicitation. Past performance is not indicative of future results. Actual returns may be higher, lower, or negative. Do not make any investment decisions based solely on this content.
SEBI and AMFI expressly prohibit distributors from guaranteeing or promising returns or future performance. All return examples and assumed rates used in this article, for example 8%, 10%, or 12%, are for illustration and comparison only. They do not represent forecasts or guarantees of any scheme or portfolio. Mutual fund returns are market-linked and can be positive, zero, or negative.
This content is part of distribution-related education and does not constitute SEBI-registered investment advice. Always read the Scheme Information Document (SID) and Key Information Memorandum (KIM) carefully before investing. For personalised guidance, consult an AMFI-registered Mutual Fund Distributor or SEBI-registered Investment Advisor.
About the Author Amit Verma | AMFI Registered Mutual Fund Distributor (ARN-349400) Verifiable at amfiindia.com I am an AMFI-registered Mutual Fund Distributor helping salaried professionals, business owners, and families across India build simple, goal-based portfolios through Regular Plans. This guidance is provided via Regular Plans offered through AMFI-registered distributors. This article does not constitute SEBI-registered investment advisory services.
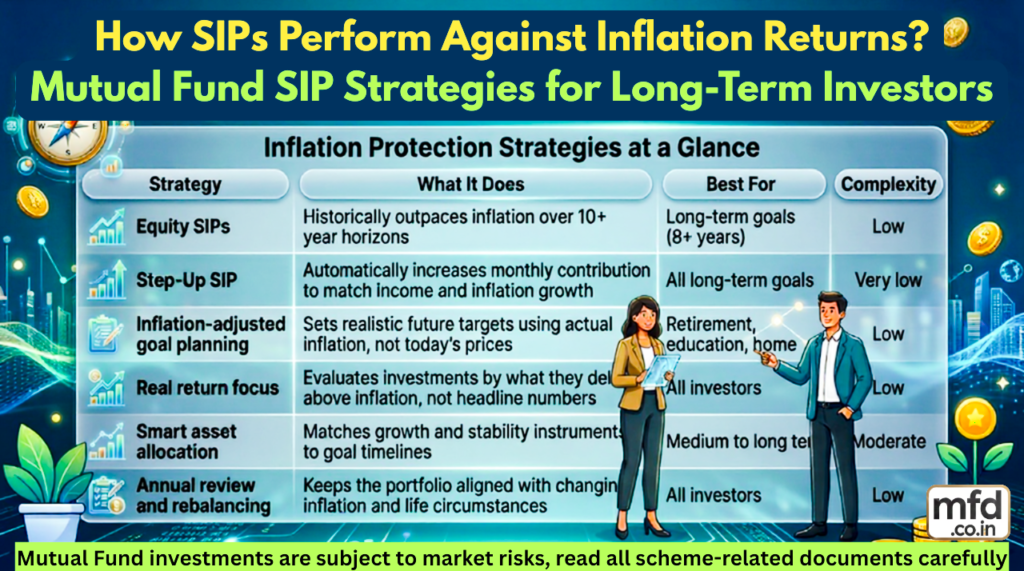
Quick Summary – Inflation Protection Strategies at a Glance
Strategy
What It Does
Best For
Complexity
Equity SIPs
Historically outpaces inflation over 10+ year horizons
Long-term goals (8+ years)
Low
Step-Up SIP
Automatically increases monthly contribution to match income and inflation growth
All long-term goals
Very low
Inflation-adjusted goal planning
Sets realistic future targets using actual inflation, not today’s prices
Retirement, education, home
Low
Real return focus
Evaluates investments by what they deliver above inflation, not headline numbers
All investors
Low
Smart asset allocation
Matches growth and stability instruments to goal timelines
Medium to long term
Moderate
Annual review and rebalancing
Keeps the portfolio aligned with changing inflation and life circumstances
All investors
Low
This is educational guidance only; individual suitability always depends on your personal financial situation and goals. All investments remain subject to market risk.
Let me start with a scenario that I find myself explaining regularly.
An investor has been putting ₹5,000 per month into a bank fixed deposit for 25 years. Faithfully, without interruption. At the end, the account has grown to approximately ₹60 lakh, a number that seems substantial until you calculate what ₹60 lakh in 25 years actually buys in terms of today’s goods and services. The answer, at a long-term average inflation rate of 5–6%, is roughly what ₹17–20 lakh buys today.
The money grew. But the purchasing power of that money, what it can actually exchange for in the real economy, has been cut to about a third of what the headline number suggests. This investor did not lose money in the conventional sense. But they lost something just as important: wealth in real terms.
This is the inflation problem. And it is the reason that understanding how to build inflation protection into a long-term SIP portfolio is not a marginal concern for sophisticated investors, it is a foundational issue for every person who is investing for a goal that is 10, 15, or 25 years away.
This article explains what inflation is doing to your investments right now, why some instruments that feel safe are actually the most dangerous for long-term goals, and the specific, practical strategies, equity SIPs, step-up SIPs, real return focus, inflation-adjusted goal planning, and annual rebalancing, that build genuine purchasing power protection over time.
This is educational guidance only. Individual suitability depends on your personal financial situation, goals, and risk profile.
Part One: Understanding Inflation – The Numbers That Matter in April 2026
What Inflation Actually Is and Why It Matters to Investors
Inflation is the rate at which the general level of prices for goods and services rises over time. When inflation is 6%, it means that something that costs ₹100 today will cost ₹106 in a year’s time. This seems modest until you compound it: at 6% annual inflation, prices double in approximately 12 years. What costs ₹1,00,000 today costs ₹2,00,000 in 12 years. Your retirement corpus, your child’s education fund, your home down payment, all of these goals need to be sized for future prices, not today’s prices.
The personal finance implication is direct: any investment that earns less than the inflation rate over your investment horizon is actually making you poorer in real terms, even if the nominal balance is growing.
India’s Inflation Context – Verified April 2026 Data
India’s CPI inflation stood at 3.40% in March 2026 (provisional), up from 3.21% in February 2026. Rural inflation was 3.63% and urban inflation was 3.11% for the same month. This is within the RBI’s inflation target band of 4% ±2%.
Looking ahead, analysts and RBI projections suggest CPI inflation is likely to average around 4.6% in FY2026–27, higher than the current March 2026 reading, with upward pressure expected from energy prices, food inflation, and global commodity dynamics.
Period
Approximate Average CPI Inflation
Key Context
FY2000–FY2010
~6.2%
Higher volatility; pre-inflation targeting era
FY2010–FY2020
~5.8%
Moderation as RBI adopted flexible inflation targeting
FY2020–FY2026
~4.8%
Further moderation; March 2026 reading at 3.40%
FY2026–27 (projected)
~4.6%
RBI projection; upside risks from energy and food
Source: MOSPI CPI data (provisional for March 2026), RBI projections, industry analyst estimates. Past inflation is not indicative of future inflation.
Critical note for long-term planning: The current March 2026 reading of 3.40% is a relatively low point in the historical context. For long-term financial planning purposes, goals that are 10–25 years away, it is prudent to use 5–6% as a conservative long-term inflation assumption, rather than extrapolating the current benign reading indefinitely. Long-term goals will live through multiple inflation cycles, including periods significantly above the current level.
The Rule of 72 – A Quick Mental Model for Inflation
The Rule of 72 provides a quick way to understand how long inflation takes to halve your purchasing power:
Assumed Inflation Rate
Years for Prices to Double
Years for ₹1 lakh to “Feel Like” ₹50,000
4%
18 years
18 years
5%
14.4 years
14.4 years
6%
12 years
12 years
7%
10.3 years
10.3 years
The Rule of 72 is an approximate mathematical shortcut. Actual compounding results may vary slightly. These are illustrative calculations.
If you are planning for retirement 25 years from now and inflation averages 6% over that period, your current monthly expenses of ₹50,000 will need to be funded at approximately ₹2.1 lakh per month in retirement just to maintain the same standard of living. This is not dramatic exaggeration, it is straightforward compounding arithmetic.
Real Return vs Nominal Return – The Most Important Distinction
Most investors track the nominal return, the headline percentage their investment shows on a statement. The number that actually matters for building wealth is the real return, the nominal return minus inflation.
Investment
Nominal Return
Inflation Rate
Real Return
What This Means
Bank savings account
3.5%
5%
-1.5%
Losing purchasing power every year
Fixed deposit
7%
5%
2%
Very modest real growth
Equity mutual fund (long-term avg.)
12%
5%
7%
Meaningful real wealth creation
All return figures are illustrative and historical averages. Not a guarantee of future returns. Actual returns may be significantly higher or lower.
The difference between a 2% real return and a 7% real return may sound modest. Compounded over 25 years on ₹10,000 per month, the gap in final real purchasing power is enormous, and this is precisely the gap between instruments that protect against inflation and instruments that do not.
Part Two: Why “Safe” Investments Can Be Dangerous for Long-Term Goals
One of the most important and counterintuitive insights in long-term financial planning is that the instruments many investors associate with safety, bank fixed deposits, savings accounts, recurring deposits, are often the most dangerous choices for goals that are 10 or more years away.
The danger is not market volatility. It is inflation risk.
The Fixed Deposit Trap
Consider an investor who keeps ₹10 lakh in a fixed deposit earning 7% per year over 15 years.
Parameter
Value
Initial investment
₹10 lakh
FD interest rate (assumed)
7% p.a.
Inflation rate (assumed)
6% p.a.
Nominal value after 15 years
~₹27.6 lakh
Inflation-adjusted value (in today’s purchasing power)
~₹11.5 lakh
Strictly illustrative. Tax on FD interest (at income slab rate) would further reduce the effective real return. Actual FD rates and inflation will vary.
In nominal terms, the investor’s ₹10 lakh grew to ₹27.6 lakh – a gain that looks impressive. In real terms, adjusted for what that money can actually buy, it grew to approximately ₹11.5 lakh in today’s purchasing power. The investor barely kept pace with inflation, and after accounting for income tax on the FD interest (which is taxed at the investor’s slab rate, potentially 20–30%), the real return becomes negative.
For short-term goals, money needed within 1–3 years, bank FDs and liquid funds are appropriate. The stability and predictability they offer is exactly what short-term goals require. The problem arises when investors use the same low-return, low-risk instruments for goals that are 10–20 years away, where inflation has time to systematically erode purchasing power.
The Silent Cost of Inflation on Long-Term Goals
A ₹10 lakh investment at different real return levels over 25 years illustrates the gap:
Real Return Level
Final Corpus in Today’s Purchasing Power (25 years)
-1% real (savings account scenario)
~₹7.8 lakh
+1% real (FD after tax, inflation scenario)
~₹12.8 lakh
+3% real (hybrid fund scenario)
~₹20.9 lakh
+6% real (equity mutual fund scenario)
~₹43 lakh
Strictly illustrative. Based on assumed real returns compounded over 25 years. Not a guarantee. Actual outcomes will differ based on actual returns, inflation, and taxes. All investments subject to market risk.
The difference between the savings account scenario and the equity scenario is not the nominal growth, it is the purchasing power actually created. The equity fund investor ends up with approximately five to six times more real wealth from the same initial ₹10 lakh, over the same 25 years.
Part Three: Strategy 1 – Equity SIPs for Long-Term Inflation Protection
Why Equity Has Historically Been the Best Inflation-Beating Asset
The reason equity has historically delivered real returns above inflation is structural. Companies generate revenues and profits from real economic activity. When input costs rise due to inflation, businesses generally pass those costs on to customers through higher prices, which means corporate revenues and earnings grow broadly in line with or above inflation over time. This is not a guarantee that equity will always outperform inflation, but it is the structural reason why, over long enough periods, equity markets have historically delivered positive real returns.
Historical Context: Nifty 50 vs Inflation (Educational Reference Only)
The Nifty 50 index has accumulated a significant data history since its 1991 base. Analysis of this history provides useful context for long-term planning, with the important caveat that past performance is not indicative of future results.
Time Horizon
Nifty 50 TRI Approximate Average CAGR
Average CPI Inflation
Approximate Real Return
35-year (1991–2026)
~12.7%
~5%
~7.3%
20-year rolling average
~11.8%
~5–6%
~5.8–6.8%
15-year rolling average
~11.8%
~5–6%
~5.8–6.8%
10-year rolling average
~11.3%
~5–5.5%
~5.8–6.3%
Source: Analysis of Nifty 50 TRI historical data. These are approximate historical averages – not a guarantee of future returns. Actual fund returns vary by scheme, expense ratio, and market timing. Past performance is not indicative of future results. All investments subject to market risk.
One of the most significant data points from this historical record: across any 7-year rolling window in the Nifty 50’s history since 1991, there has been no period with a negative CAGR. This is not a guarantee for the future, but it does suggest that equity investing with a minimum 7-year time horizon has historically provided meaningful inflation protection without permanent capital loss in a broad market index context.
For long-term goals, retirement in 20–25 years, children’s education in 12–15 years, this historical pattern supports the case for equity-oriented mutual fund SIPs as the primary inflation-protection instrument.
Which Equity Fund Categories Are Generally Suitable for Long-Term Inflation Protection
This is educational guidance only. Actual fund selection should be based on individual risk profile, goals, and should involve consultation with a registered distributor.
Fund Category
Why It Helps With Inflation
Suitable Time Horizon
Flexi-cap funds
Dynamic allocation across market caps; manager can adapt to economic cycles
Higher growth potential over long periods; higher volatility
10+ years
Multi-asset funds
Built-in allocation to equity, debt, and gold; moderate inflation protection
5+ years
The key principle: equity exposure is appropriate for goals that are at least 7–10 years away. For goals within 3 years, equity introduces volatility risk that is inappropriate. For goals 3–7 years away, hybrid or balanced funds are often more suitable.
Part Four: Strategy 2 – The Step-Up SIP, the Single Most Powerful Inflation-Beating Tool
If equity SIPs address which asset class to invest in, the step-up SIP addresses how your investment amount should grow over time to keep pace with inflation and income growth.
Why a Flat SIP Amount Loses Ground to Inflation
When you start a ₹5,000 monthly SIP at age 25 and keep it flat for 30 years, the ₹5,000 you are investing at age 54 has the purchasing power of approximately ₹1,900 in today’s terms (at 3.5% real wage growth erosion). In other words, the real sacrifice you are making each month is declining, which means you are effectively saving less in real terms as time passes, even as your income presumably grows.
A flat SIP is better than no SIP. But a step-up SIP, where the monthly amount increases by a fixed percentage each year, is significantly better than a flat SIP for long-term wealth creation and inflation protection.
The Mathematical Case for Step-Up SIPs
The following illustrative comparison uses a 30-year investment horizon. These are strictly illustrative calculations. 12% assumed return is a historical long-term average, not a guarantee. Actual returns may vary significantly.
SIP Type
Starting Amount
Step-Up
Total Invested (30 years)
Illustrative Corpus at 12% CAGR
Flat SIP
₹5,000/month
None
₹18 lakh
~₹1.76 crore
10% annual step-up
₹5,000/month
+10% per year
~₹40 lakh
~₹3.63 crore
15% annual step-up
₹5,000/month
+15% per year
~₹74 lakh
~₹6.30 crore
Strictly illustrative. 12% p.a. is a historical long-term average for equity-oriented funds, not guaranteed. Actual outcomes will vary significantly. All investments subject to market risk.
The 10% annual step-up investor puts in approximately twice as much money but ends up with approximately twice the corpus, the compounding on the additional early contributions makes the step-up extraordinarily effective. The 15% step-up investor, putting in roughly four times the money, ends up with approximately three to four times the corpus.
But there is a second reason step-up SIPs are specifically inflation-protective beyond their raw compounding effect: they ensure that your investment grows at least as fast as your income, preventing lifestyle inflation from consuming 100% of salary increases. If your salary grows by 8–10% per year and your SIP grows by 10% per year, the proportion of your income going to future wealth creation remains constant or grows, exactly what inflation protection requires.
How to Implement a Step-Up SIP
Most mutual fund platforms and distributor-facilitated registrations now support automatic step-up features at the time of SIP creation. You can typically set:
An annual percentage increase (e.g., 10% per year)
A fixed annual rupee increase (e.g., ₹500 more each year)
A conditional step-up tied to calendar events
If automatic step-up is not available on your platform, a simple solution is a recurring calendar reminder in the first week of April each year, the start of the Indian financial year, to manually increase each SIP by 10%. This takes about five minutes and has a compounding impact over decades that is one of the most valuable financial habits you can build.
Part Five: Strategy 3 – Set Inflation-Adjusted Goals, Not Today’s Prices
This is the strategy that most changes how investors think about their financial goals, and the one that most consistently reveals that people are significantly under-saving relative to what their goals will actually cost.
The Core Problem: Planning With Today’s Prices for Tomorrow’s Goals
When someone says “I want to accumulate ₹50 lakh for my child’s education,” they usually mean ₹50 lakh in today’s purchasing power. But the education will happen in 15 years, at prices that will be substantially higher than today’s prices, especially because education costs in India have historically risen faster than general CPI inflation, at approximately 8–10% per year in many segments.
Goal
Today’s Cost
Education Inflation
Years Away
Inflation-Adjusted Future Cost
Engineering degree
₹10 lakh
8% p.a.
13 years
~₹27 lakh
Medical degree (MBBS)
₹30 lakh
8% p.a.
15 years
~₹95 lakh
House down payment
₹25 lakh
5% p.a.
8 years
~₹37 lakh
Retirement corpus (₹60,000/month living expenses)
₹60,000/month × 25 years
6% p.a.
25 years until retirement
See retirement section
Strictly illustrative. Education inflation rates and property cost appreciation vary significantly by city, institution, and market conditions. These are planning scenarios, not predictions.
The practical implication: when you set a financial goal, always calculate the future cost using an appropriate inflation assumption, not today’s price. A goal planned at today’s prices will be systematically under-funded, producing the frustration of working diligently toward a number and arriving to find it is no longer enough.
A Simple Three-Step Process for Inflation-Adjusting Your Goals
Step 1: Write down the current cost of your goal in today’s prices.
Step 2: Choose an appropriate inflation rate for that goal type:
General living expenses: 5–6%
Education costs: 7–9%
Healthcare costs: 8–10%
Housing: 4–6% (highly variable)
Step 3: Use the compound growth formula: Future Cost = Current Cost × (1 + Inflation Rate)^Years. Or use any free online inflation calculator to compute this.
Once you have the future cost, run a goal-based calculator to find the monthly SIP required to reach that number. This is the SIP amount you actually need, not the amount that would be right if prices stayed frozen at today’s levels.
Part Six: Strategy 4 – Focus on Real Returns, Not Nominal Returns
This strategy is about changing how you evaluate and select investments for long-term goals. It requires a mental shift from asking “what return is this giving me?” to “how much above inflation is this giving me?”
For practical planning, a simpler approximation works well: Real Return ≈ Nominal Return − Inflation Rate
Investment Type
Typical Nominal Return
Inflation Assumption
Approximate Real Return
Wealth Created Over 20 Years on ₹10 Lakh (Illustrative)
Savings account
3.5%
5%
-1.5%
₹7.4 lakh (negative real)
Fixed deposit (pre-tax)
7%
5%
2%
₹14.8 lakh
Hybrid / balanced fund
9–10%
5%
4–5%
₹22–26.5 lakh
Equity-oriented fund
11–13%
5%
6–8%
₹32–46.6 lakh
Strictly illustrative. All return figures are assumed for comparison only. FD returns also attract income tax at slab rate, which further reduces real returns. Equity fund returns are market-linked and can be significantly lower or higher. Past performance is not indicative of future results.
When you evaluate your portfolio through the lens of real returns, several things become clear:
A savings account is not a neutral holding place – it is an investment that loses purchasing power in real terms every year
An FD earning 7% when inflation is 5% is delivering 2% real growth – valuable for short-term goals but inadequate for long-term wealth creation
An equity-oriented fund that delivers 12% nominal return with 5% inflation is delivering 7% real return – which, compounded over 20+ years, produces meaningfully more purchasing power than any of the alternatives
What “Inflation Protection” Actually Means in Portfolio Terms
For a portfolio to provide genuine inflation protection, it needs to deliver a positive real return, meaningfully above the inflation rate, over the relevant investment horizon. For most long-term goals, this means targeting a real return of at least 4–6%, which historically has required meaningful equity exposure.
This does not mean the entire portfolio should be in equity at all times. It means that the Growth bucket – the portion allocated to goals that are 8+ years away, should have equity exposure sufficient to deliver the real returns that inflation protection requires.
Part Seven: Strategy 5 – Smart Asset Allocation for Different Inflation Scenarios
Different asset classes respond differently to inflation. A well-constructed portfolio should think about this explicitly, particularly for goals over different time horizons.
How Different Asset Classes Respond to Inflation
Asset Class
When Inflation Rises
When Inflation Falls
Long-Term Inflation Protection
Equity
Can struggle short-term; strong long-term real returns
Generally performs well
Strong – businesses pass costs on
Gold
Often rises with inflation (store of value)
Less compelling
Moderate – good inflation hedge
Debt / Bonds
Existing bonds lose value; new bonds offer higher rates
Existing bonds gain value
Weak for long tenures
Liquid / ultra-short funds
Returns adjust to current rates
Moderate returns
Neutral – tracks short-term rates
Real estate
Generally appreciates with inflation
Moderate
Moderate – variable by location
A Simple Asset Allocation Framework by Goal Horizon
This is a general educational framework only. Individual allocation should reflect personal risk profile, goals, and circumstances. Consult a registered distributor before acting.
Goal Timeline
Suggested Broad Allocation
Primary Rationale
0–3 years
80–100% debt/liquid
Stability required; inflation secondary concern over short term
3–7 years
40–60% equity, 40–60% hybrid/debt
Balance growth with stability
7–15 years
60–80% equity, 20–40% debt
Equity needed for real return; time for market cycles to play out
15+ years
70–90% equity, 10–20% debt/gold
Maximum growth focus; inflation protection primary requirement
The presence of gold in a long-term portfolio deserves specific mention. Gold has historically delivered approximately 10–11% CAGR in Indian rupee terms over 20 years, comfortably above long-term inflation, and has the useful property of often moving differently from equity markets. A 10–15% gold allocation in long-term portfolios, accessible through gold-backed mutual funds or multi-asset funds that include gold, adds an inflation hedge that complements the equity allocation.
Part Eight: Strategy 6 – Avoid Over-Concentration in Low-Return Instruments for Long-Term Goals
This strategy is less about doing something new and more about stopping something that is quietly harmful: keeping the majority of your long-term goal savings in fixed deposits, recurring deposits, or savings accounts because they feel safe.
The feeling of safety from market volatility is real, these instruments do not fluctuate. But the loss of purchasing power from inflation over 15–20 years is also real, and it is certain rather than probabilistic. An FD will definitely lose purchasing power in real terms over 20 years if inflation exceeds the post-tax FD rate. An equity fund might deliver below-inflation returns over some 5-year windows but has historically recovered and delivered positive real returns over 15–20 year horizons.
The Practical Boundary
For goals within 3 years: bank FDs, liquid funds, and ultra-short duration debt funds are appropriate. The stability they provide matches the requirement of short time horizons.
For goals 3–7 years away: hybrid funds that combine equity and debt provide a middle path, some inflation protection, some stability.
For goals 8+ years away: equity-oriented mutual funds, held through SIPs, are the appropriate inflation-protection instrument. The discomfort of short-term market volatility is the price paid for the long-term real returns that these goals require.
The simplest test for any existing long-term savings holding: calculate its real return (subtract expected long-term inflation of 5–6% from the nominal return). If the real return is less than 2%, the holding is providing inadequate inflation protection for a long-term goal.
Part Nine: Strategy 7 – Annual Review and Rebalancing
All the strategies described so far, equity SIPs, step-up SIPs, inflation-adjusted goals, smart allocation, need a mechanism to stay current as circumstances change. That mechanism is the annual portfolio review.
What the Annual Review Should Cover
Review Area
What to Check
Action if Required
Current inflation trend
Is actual inflation tracking higher or lower than planning assumption?
Adjust return expectations and future goal costs accordingly
Step-up SIP execution
Did the automatic step-up process correctly?
Manual increase if automatic feature did not execute
Goal inflation recalculation
Have your goals’ expected future costs increased?
Increase SIP amounts to match revised future costs
Asset allocation check
Has equity allocation drifted significantly from target due to market movements?
Rebalance toward target allocation
Real return assessment
Are investments delivering positive real returns over a 3–5 year period?
Review fund selection if consistent real return underperformance
Life change assessment
New goals, changed timelines, significant income change?
Restructure portfolio to reflect new circumstances
The April timing is natural, aligned with the start of the Indian financial year, many investors receive salary revisions around this time, making it an ideal moment to increase SIP amounts by at least 10% to reflect both income growth and the step-up commitment.
When to Rebalance More Actively
Beyond the annual review, certain events warrant interim reassessment:
Trigger
Action
Equity allocation drifts more than 10% from target (e.g., target 70%, actual 82% after a strong rally)
Partial rebalancing toward debt/gold
Major life event (new child, new goal, income change)
Restructure goal buckets
A goal moves within 3 years of its target date
Begin systematic de-risking – shift Growth bucket for that goal toward Balance or Safety
Inflation meaningfully above long-term assumption for 2+ years
Reassess whether SIP amounts need to increase further
Putting It Together – An Illustrative Inflation-Protected SIP Structure
This is a strictly educational illustration. No specific amounts, fund selection, or allocation constitute personalised advice. Individual portfolios must be based on personal goals, risk profile, and circumstances. Consult a registered distributor.
Consider a 30-year-old investor with the following goals:
Goal
Horizon
Current Cost
Inflation Assumption
Future Cost
Monthly SIP Needed (at 10% assumed return)
Emergency fund
3 years
₹3 lakh
5%
₹3.47 lakh
~₹8,500 (in liquid fund)
Home down payment
8 years
₹25 lakh
5%
₹36.9 lakh
~₹24,000
Child’s education
16 years
₹20 lakh
8%
₹67.5 lakh
~₹16,000
Retirement
30 years
₹50,000/month today
6%
~₹2.87 lakh/month
~₹22,000
All figures strictly illustrative. 10% return assumption is not guaranteed. Future cost calculations use the compound inflation formula. Actual required SIPs will differ based on actual returns and inflation. All investments subject to market risk.
The total monthly commitment across all four goals is approximately ₹70,500 at age 30. With a 10% annual step-up SIP in place for the long-horizon goals, this commitment grows with income rather than representing a fixed burden. By age 40, the monthly amount is higher in absolute rupees, but as a proportion of a grown income, it remains manageable.
The inflation-protection principle: all goals priced in future rupees, not today’s rupees. All long-horizon allocations in equity-oriented instruments. All short-horizon allocations in debt/liquid instruments. Step-up SIPs ensuring that contributions grow at least as fast as income.
Common Mistakes That Destroy Inflation Protection
Planning with today’s prices for tomorrow’s goals. The retirement corpus that looks adequate at today’s spending levels may fund only half as long in 20 years’ time if inflation is not factored in. Always inflation-adjust your goal targets.
Using equity-oriented returns in debt-heavy portfolios. Some investors calculate their goals using 12% assumed returns but hold the majority of their portfolio in FDs and recurring deposits. The calculator produces a monthly SIP that would be appropriate for equity returns but the portfolio is not actually earning those returns.
Stopping the step-up SIP when money feels tight. The step-up SIP should be the last thing reduced during a difficult financial period, precisely because its long-term compounding effect is so significant. Reducing from the Growth bucket for non-emergency reasons permanently reduces the long-term real returns.
Over-reacting to short-term market falls by exiting equity. A temporary market fall does not indicate that equity has failed as an inflation-protection instrument. Exiting equity during a correction and moving to FDs is often the equivalent of locking in real-return underperformance permanently, having experienced the volatility of equity without getting the long-term real return.
Ignoring education-specific inflation. Using 5–6% general CPI inflation for education goals, when education costs have historically risen at 8–10% annually, significantly underestimates the required corpus. Always use category-appropriate inflation assumptions.
Common Questions on Inflation and SIPs
“Is 12% a realistic assumed return for equity SIP planning?”
The historical long-term average for the Nifty 50 TRI since 1991 is approximately 12.7% CAGR. The 20-year rolling average is approximately 11.8%. Most financial planning professionals use 10–12% as a moderate planning assumption for equity-oriented funds and 8% as a conservative assumption. Importantly, the 12% includes very strong bull-market periods and challenging periods, it is not what any single future period should be expected to deliver. Use 8–10% for conservative planning; use 12% as an optimistic scenario. Actual fund returns depend on fund category, manager performance, expenses, and market conditions. None of these are guarantees.
“What if current inflation remains at 3–4% long-term? Does equity still make sense?”
Even at 3–4% inflation, an FD earning 7% delivers only 3–4% real return, and the FD interest is taxed at slab rates, reducing the real post-tax return further. An equity-oriented fund delivering 11–12% nominal still delivers 7–8% real return at 3–4% inflation. Lower inflation does not weaken the case for equity for long-term goals; it reduces the urgency slightly but does not change the fundamental real-return comparison.
“Should I increase my SIP when inflation goes up?”
Yes, this is one of the most important responses to an extended period of above-average inflation. If your planning assumption was 5% inflation and actual inflation is running at 7% for multiple years, your future goal costs are higher than you planned for. Increasing your SIP by at least the difference ensures you stay on track. The step-up SIP should ideally exceed inflation by at least the rate of your income growth, typically 8–12% per year, to maintain meaningful forward progress toward goals in real terms.
“Is gold a good inflation hedge for a mutual fund portfolio?”
Gold has historically delivered approximately 10–11% CAGR in Indian rupee terms over 20+ years, comfortably above long-term inflation. It also has the property of moving somewhat independently of equity markets, providing portfolio diversification. A 10–15% allocation to gold through gold-oriented mutual funds or multi-asset funds that include gold can provide a useful inflation hedge within a diversified portfolio. It should not be the primary inflation-protection instrument for long-term goals, that role belongs to equity, but as a complement, it has a constructive historical record.
“How do I account for inflation in my retirement planning?”
The key step is calculating your monthly living expenses in retirement, not at today’s prices, but at the prices that will prevail when you retire. At 6% inflation over 25 years, ₹50,000 of today’s monthly expenses becomes approximately ₹2.15 lakh per month at retirement. The retirement corpus needs to be large enough to sustain that inflation-adjusted monthly expense for 25–30 years of retirement. This calculation almost always produces a larger number than people initially expect, which is why running it early and acting on it early is so important.
How a Registered Distributor Helps With Inflation Planning Specifically
As an AMFI-registered mutual fund distributor, helping investors build genuine inflation protection into their portfolios is one of the most important things I do. These are educational and guidance-only services; all investments remain subject to market risk. Any actual portfolio construction involves individual KYC, suitability assessment, and documentation.
The practical work involves: calculating inflation-adjusted future costs for each goal, selecting appropriate fund categories for each goal’s time horizon, setting up step-up SIPs from day one, and conducting the annual review that keeps everything calibrated to changing circumstances.
The behavioural value is equally important: providing the perspective that keeps an investor in their equity SIPs during a market correction, when the temptation to switch to “safe” FDs is highest and the inflation-protection case for equity is most directly at risk from a poor decision.
The data is consistent: investors who receive ongoing distributor guidance are significantly more likely to stay invested through market cycles and to hold equity SIPs for 5+ years, which is precisely the holding period required for the inflation-protection properties of equity to manifest fully.
Final Point – Inflation Is the Real Enemy, Not Market Volatility
Market volatility is visible, emotionally intense, and temporary. Portfolio values fall and recover. The news covers it. Friends talk about it.
Inflation is invisible, emotionally neutral, and permanent. Purchasing power erodes quietly over years. No one sends you a statement showing that your ₹10 lakh FD balance is worth only ₹6.5 lakh in real terms. No news ticker shows you that your “safe” savings account is losing 1.5% of purchasing power per year. The damage is real and accumulating, but it is silent.
This asymmetry, between the emotional intensity of market volatility and the invisible permanence of inflation, is why so many investors end up in instruments that feel safe and actually are not: they are insulated from the discomfort of short-term fluctuations while being slowly and certainly impoverished by inflation over the decades when their wealth should be growing fastest.
The strategies described in this article, equity SIPs for long-term goals, step-up SIPs that grow with income, inflation-adjusted goal planning, real return focus, smart allocation by time horizon, and annual rebalancing, are not complex or exotic. They are the straightforward application of compound mathematics to the reality of a world where prices rise year after year.
Start by knowing what inflation is doing to your goals right now. Then make the structural changes, equity SIPs, step-up automation, inflation-adjusted targets, that put compounding on your side rather than against you.
If you would like help building a goal-by-goal inflation analysis and a step-up SIP plan designed specifically for your timeline, I am here to work through it with you. Free 15-minute chat, no obligation, no pressure. This is purely distribution-related guidance; mutual fund investments are always subject to market risk. Do not make any investment decisions based solely on this conversation or this article – always read all scheme-related documents and consult appropriate professionals before acting.
About the Author Amit Verma | AMFI Registered Mutual Fund Distributor (ARN-349400) Verifiable at amfiindia.com
I am an AMFI-registered Mutual Fund Distributor helping salaried professionals, business owners, and families across India build simple, goal-based portfolios through Regular Plans, with inflation protection built into every goal from day one. This guidance is provided via Regular Plans offered through AMFI-registered distributors. This article does not constitute SEBI-registered investment advisory services.
Ready to Build an Inflation-Protected SIP Portfolio? 📱 WhatsApp: +91-76510-32666 – Free 15-min chat, no obligation 🌐 mfd.co.in/signup ✉️ planwithmfd@gmail.com
Before investing, please read all scheme-related documents including the Scheme Information Document (SID) and Key Information Memorandum (KIM). This is purely distribution-related guidance; do not make any investment decisions based solely on this article or this conversation.
Final Disclaimer Mutual fund investments are subject to market risks, including risk of capital loss. This article is purely educational and does not constitute investment advice, recommendation, or solicitation. Past performance is not indicative of future results. Actual returns may be higher, lower, or negative. SEBI and AMFI expressly prohibit distributors from guaranteeing or promising returns. All return examples and assumed rates in this article are strictly illustrative and do not represent forecasts or guarantees of any scheme or portfolio. This content is part of distribution-related education and does not constitute SEBI-registered investment advice. Always read the Scheme Information Document (SID) and Key Information Memorandum (KIM) carefully before investing. For personalised guidance based on your financial situation, goals, and risk profile, consult an AMFI-registered Mutual Fund Distributor or SEBI-registered Investment Advisor. Do not make any investment decisions based solely on this article.