Mutual Fund Risks Made Simple: How to Read the Risk-o-Meter, Understand Volatility, and Assess Your Tolerance
Investing in mutual funds offers potential for wealth creation, but understanding the risks involved is crucial for making informed decisions. With India’s mutual fund industry managing approximately ₹81 lakh crore (average AUM for late 2025) in assets, more investors are entering the market seeking growth opportunities. However, risk; the possibility of returns differing from expectations or potential loss of capital, must be carefully evaluated before investing. This guide simplifies the SEBI Risk-o-Meter, explains common risk types, demystifies volatility measures, and emphasizes why assessing your personal risk tolerance is essential for long-term investment success.
Decoding the SEBI Risk-o-Meter
The Risk-o-Meter is a standardized visual tool mandated by the Securities and Exchange Board of India (SEBI) to help investors quickly understand a mutual fund scheme’s risk level. Originally introduced in 2013 with a simple color-coded system and enhanced in 2015 with a graphical representation, the current six-level Risk-o-Meter became effective from January 1, 2021.
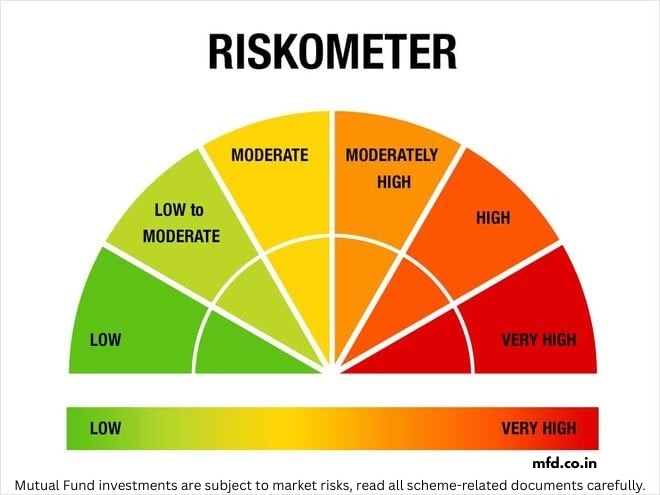
The Risk-o-Meter categorizes schemes into six distinct risk levels: Low, Low to Moderate, Moderate, Moderately High, High, and Very High. Each level is depicted on a meter resembling a speedometer, with a pointer indicating where the fund falls on the risk spectrum. This pictorial representation makes it intuitive even for first-time investors.
The risk level is calculated monthly based on quantitative parameters including market capitalization, volatility, credit ratings, interest rate sensitivity, and liquidity. For equity funds, the methodology evaluates stock volatility and market cap exposure. For debt funds, it assesses credit risk and interest rate sensitivity. Any change in the Risk-o-Meter level must be communicated to unit holders through Notice cum Addendum and via email or SMS.
The Risk-o-Meter appears prominently in Scheme Information Documents (SID), Key Information Memorandums (KIM), fund factsheets, advertisements, and application forms. When reviewing a fund, check where the pointer is positioned. A “High” or “Very High” rating indicates significant potential fluctuations, suitable for aggressive investors with longer investment horizons who can withstand volatility.
Common Types of Risks in Mutual Funds
Different mutual fund categories face varying risk profiles. Understanding these helps in portfolio diversification and appropriate fund selection:
- Market Risk: Fluctuations in security prices due to economic conditions, political events, or market sentiment. Equity funds face the highest market risk as stock prices can move unpredictably based on company performance and broader market trends.
- Credit Risk: In debt funds, this is the risk that bond issuers may default on interest payments or principal repayment. Corporate bond funds typically carry higher credit risk than government securities funds.
- Interest Rate Risk: Bond prices and interest rates have an inverse relationship. When interest rates rise, existing bond values fall, affecting debt fund NAVs. Longer-duration debt funds are more sensitive to interest rate changes than short-duration funds.
- Liquidity Risk: The difficulty of selling securities quickly without significantly impacting their price. This risk is higher in funds investing in less-traded securities or during market stress when buyers are scarce.
- Inflation Risk: The risk that investment returns may not keep pace with rising prices, eroding real purchasing power over time. This particularly affects conservative investments with lower return potential.
- Currency Risk: For international or global funds, exchange rate fluctuations can significantly impact returns when foreign investments are converted back to Indian rupees.
- Concentration Risk: Over-exposure to a single sector, stock, or theme can amplify losses if that particular area underperforms. Diversified funds help mitigate this risk.
Measuring Volatility: Key Metrics Explained
Volatility quantifies how much a fund’s returns fluctuate, providing insight into risk levels. Several metrics help measure this:
- Standard Deviation: This statistical measure shows how much a fund’s returns deviate from its average return over a period, typically calculated over 3-5 years. Higher standard deviation indicates more volatility. For example, an equity fund might show 15-20% standard deviation, while a debt fund typically ranges between 2-5%. Lower values suggest more consistent, predictable returns.
- Beta: Beta measures a fund’s sensitivity to market movements relative to its benchmark index (like Nifty 50 or Sensex). A beta of 1 means the fund moves in line with the market. Beta greater than 1 indicates higher volatility than the benchmark, while beta less than 1 suggests lower volatility. Conservative investors might prefer funds with beta below 1, while aggressive investors comfortable with volatility might choose funds with beta above 1 for potentially higher growth.
- Sharpe Ratio: This risk-adjusted return metric shows how much excess return a fund generates over the risk-free rate (typically government securities) per unit of volatility, using standard deviation. A higher Sharpe Ratio indicates better risk-adjusted returns. A Sharpe Ratio above 1 is generally considered good, indicating the fund compensates investors adequately for the risk taken. This metric is particularly useful when comparing funds within the same category.
These metrics are typically available in fund factsheets, AMC websites, and financial portals like Value Research or Morningstar. Remember to compare funds within the same category, as volatility varies significantly between equity, debt, and hybrid funds.
Why Risk Tolerance Assessment Matters
Risk tolerance represents your financial ability and psychological willingness to endure potential losses or volatility in your investments. It’s assessed through factors including age, income stability, financial goals, investment horizon, existing assets, and past investment experience.
Understanding your risk profile is critical because misalignment between your tolerance and fund selection can lead to poor outcomes. Conservative investors with low risk tolerance may panic and redeem during market corrections, potentially locking in losses. Conversely, investing too conservatively might result in insufficient growth to meet long-term goals, especially when inflation is factored in.
AMFI encourages investors to complete risk profiling before investing. Many fund houses and distributors offer online risk assessment tools through simple questionnaires. Generally, investors are categorized as conservative (preferring capital preservation, suited to debt funds), moderate (comfortable with balanced portfolios, suited to hybrid funds), or aggressive (focused on growth, suited to equity funds).
Your risk tolerance should align with your goals and time horizon. Long-term goals like retirement (20-30 years away) can typically accommodate higher equity exposure despite short-term volatility, as there’s time to recover from downturns. Short-term goals (3-5 years) require stability, making debt or conservative hybrid funds more appropriate.
Risk tolerance isn’t static; it may change with life stages, income changes, or market experiences. Regular reassessment ensures your portfolio remains aligned with your current circumstances and comfort level.
Disclaimer: Mutual fund investments are subject to market risks. Read all scheme-related documents carefully before investing. This article is for educational purposes only and should not be construed as investment advice, recommendation, or solicitation. Past performance is not indicative of future results. The risk metrics and categories mentioned are general in nature and may not suit all investors. Please consult SEBI-registered investment advisors or AMFI-registered mutual fund distributors for personalized guidance based on your individual financial situation, goals, and risk profile.