Reading time: 22–26 minutes
🚨 CRITICAL DISCLAIMER
This content is for educational and informational purposes only. Mutual fund investments are subject to market risks, including the risk of loss of principal. This is NOT investment advice, a recommendation to buy or sell any specific fund, or a guarantee of future performance. Past performance is not indicative of future results.
Do not make investment decisions based solely on this content or any single metric. Always consult a SEBI-registered investment adviser or AMFI-registered mutual fund distributor for personalised guidance based on your complete financial situation, goals, and risk tolerance.
AMFI-registered Mutual Fund Distributor | ARN-349400 (verifiable at amfiindia.com)
Table of Contents
- Introduction: Why the Factsheet Is Your Most Important Investing Document
- What Is a Mutual Fund Factsheet?
- The 12 Key Sections Every Beginner Must Master
- Step-by-Step Beginner’s Checklist: How to Read a Factsheet in 10 Minutes
- Red Flags & Green Flags: What to Watch For
- How SEBI’s 2025–2026 Rules Changed Factsheet Disclosures
- Real-World Example: Reading a Sample Large-Cap Equity Fund Factsheet
- Advanced Tips: Going Beyond the Basics Like a Pro
- Common Mistakes Beginners Make When Reading Factsheets
- Practical Framework: Your Monthly Factsheet Review Routine
- Comprehensive FAQ Section (25+ Questions)
- The Bottom Line: Turn Factsheets into Your Superpower
- Contact & Distribution Services
- Regulatory Disclosure
1. Introduction: Why the Factsheet Is Your Most Important Investing Document
Every month, fund houses publish a detailed factsheet for every mutual fund scheme they manage. Most beginners glance at the returns, the bold numbers at the top, and move on, assuming they’ve understood the fund. Some don’t even read it at all, relying on star ratings or word-of-mouth recommendations.
This is a costly mistake.
The factsheet is the single most important document for evaluating a mutual fund. It is the fund’s official report card, a standardised, SEBI-mandated disclosure that reveals the fund’s true character, risks, costs, consistency, and the manager’s skill. Everything you need to make an informed investment decision is there, buried in the tables, charts, and footnotes.
In 2026, with SEBI’s landmark new regulations coming into force from April 1, 2026 – including the restructured Base Expense Ratio (BER) disclosure framework, mandatory portfolio overlap reporting under the February 2026 categorisation circular, stricter “true-to-label” enforcement, and enhanced governance standards, the factsheet has become even more powerful and, for the uninitiated, slightly more complex.
This beginner-friendly yet comprehensive guide teaches you to read any mutual fund factsheet like a seasoned investor. You’ll learn exactly what each section means, what numbers truly matter, which red flags to spot, and a simple 10-minute checklist you can use every month to evaluate any fund confidently.
2. What Is a Mutual Fund Factsheet?
A mutual fund factsheet is an official monthly or quarterly document published by the Asset Management Company (AMC) for each of its schemes. It is a standardised, SEBI-mandated disclosure that contains everything you need to evaluate a scheme objectively, from investment objective and portfolio to performance, risk metrics, costs, and regulatory disclosures.
Think of it as the fund’s health report card. Just as you wouldn’t invest in a company without reading its annual report, you shouldn’t invest in a mutual fund without reading its factsheet. It is transparent, factual, and updated regularly, designed to help investors make informed decisions.
Key Features of a Factsheet
| Feature | Description |
|---|---|
| Frequency | Published monthly for equity funds; quarterly for some debt funds |
| Standardisation | SEBI-mandated format ensures consistency across fund houses |
| Accessibility | Available on AMC websites, AMFI, Value Research, and MF Utility |
| Comprehensiveness | Covers performance, portfolio, risk, costs, and disclosures |
| Currency | Reflects portfolio as of month-end (for monthly factsheets) |
Where to Find Factsheets
| Source | Notes |
|---|---|
| AMC Website | Most reliable; official source |
| AMFI India (amfiindia.com) | Consolidated repository |
| Value Research / Morningstar India | User-friendly presentation with additional analysis |
| MF Utility (MFU) | AMFI-backed platform |
3. The 12 Key Sections Every Beginner Must Master
Section 1: Scheme Name, Objective & SEBI Category
What to Check:
- Scheme Name: Includes category (e.g., “XYZ Large Cap Fund,” “ABC Flexi Cap Fund”)
- Investment Objective: What the fund aims to achieve (e.g., “long-term capital appreciation through investment in large-cap stocks”)
- SEBI Category: Large Cap, Mid Cap, Small Cap, Flexi Cap, etc. – this determines the fund’s investment universe
Why It Matters: SEBI’s “true-to-label” rules (strengthened under the February 2026 categorisation circular) ensure that a fund’s name and category must accurately reflect its portfolio. A “Large Cap Fund” must now invest at least 80% in large-cap stocks (revised upward from 65% under the Feb 2026 circular). If the portfolio deviates, it is a red flag.
What a Pro Notices: The objective statement often reveals subtle nuances – some funds target “growth,” others “value,” some focus on “dividend yield.” Ensure the objective aligns with your investment goal.
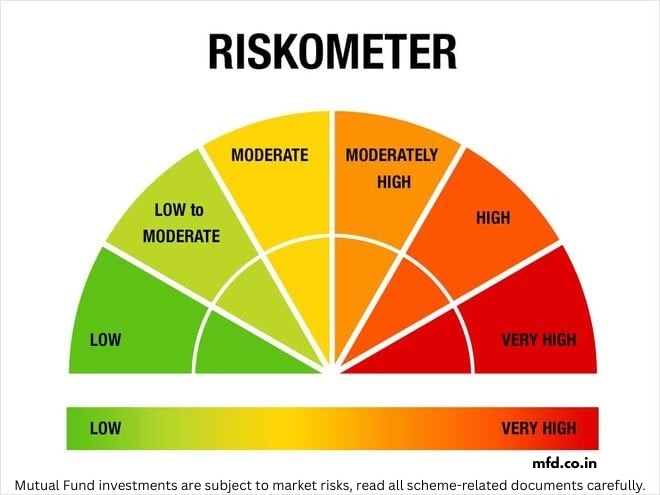
Section 2: Risk-o-Meter
What to Check:
- Visual gauge showing: Low → Moderately Low → Moderate → Moderately High → High → Very High
- Updated whenever material changes occur in the actual portfolio (not just at category level)
Why It Matters: The Risk-o-Meter tells you the fund’s current risk level based on its actual holdings. Unlike category-based risk labels of the past, this is dynamic – a large-cap fund may show “Moderate” most months but could shift to “Moderately High” if it adjusts its holdings.
What a Pro Notices: Check if the Risk-o-Meter aligns with your risk tolerance. A “Very High” risk fund may be unsuitable for conservative investors regardless of past returns. Also, watch for sudden changes – a fund shifting from “Moderate” to “High” may have changed its strategy or portfolio composition.
Section 3: NAV, AUM & Minimum Investment
What to Check:
- NAV (Net Asset Value): Price per unit (shown separately for Growth and IDCW options)
- AUM (Assets Under Management): Total assets managed by the scheme
- Minimum Investment: Lump sum and SIP minimum amounts
- Exit Load: Charges for redeeming within a specified period (typically 1% for redemption within 365 days)
Why It Matters:
- NAV: Not important for comparing funds; it’s just the price per unit. A ₹100 NAV fund is not “better” or “worse” than a ₹20 NAV fund.
- AUM: Too small (< ₹100 crore) may mean liquidity issues or risk of closure. Too large (> ₹25,000 crore) may limit agility, especially in mid-cap or small-cap funds.
- Exit Load: Important for short-term investors. If you may need liquidity within a year, a high exit load is a constraint.
What a Pro Notices:
- For mid-cap/small-cap funds, AUM between ₹1,000–₹10,000 crore is often considered a reasonable range – enough for stability but not so large that it constrains stock selection.
- For large-cap funds, larger AUM (₹10,000–₹50,000 crore) is generally less concerning because the large-cap universe is deep enough to absorb it.
Section 4: Benchmark & Benchmark Index
What to Check:
- The benchmark index the fund compares itself to (e.g., Nifty 50 TRI, Nifty Midcap 150 TRI)
- For equity funds, the benchmark must be a Total Return Index (TRI), which includes dividends
Why It Matters: You evaluate a fund’s performance against its benchmark. Comparing a mid-cap fund to Nifty 50 is meaningless – it should be compared to a mid-cap index.
What a Pro Notices: Ensure the benchmark matches the fund’s category. A Flexi Cap fund should typically benchmark against Nifty 500 TRI. Also, check if the fund consistently beats its benchmark across rolling periods, not just a single trailing period.
Section 5: Performance Returns
What to Check:
- Trailing Returns: 1Y, 3Y, 5Y, 10Y, Since Inception
- Rolling Returns (increasingly disclosed): Shows consistency across overlapping periods
- Returns vs Benchmark: Usually shown in a table
- Returns vs Category Average: Often shown in quartile ranking or graphical format
Why It Matters: This is where most beginners focus, but the key is to look beyond the numbers.
What a Pro Notices:
- 3Y and 5Y returns are more meaningful than 1Y returns
- Rolling returns reveal consistency – a fund that beats the benchmark in 80% of rolling periods is far more reliable than one that beats it in 55%
- Quartile ranking: A fund consistently in the top quartile over 3Y and 5Y is excellent
Section 6: Risk Metrics & Ratios
What to Check:
- Standard Deviation: Total volatility
- Sharpe Ratio: Return per unit of total risk
- Sortino Ratio: Return per unit of downside risk
- Beta: Market sensitivity
- Alpha: Manager skill
- Information Ratio: Consistency of outperformance
- Maximum Drawdown: Worst peak-to-trough loss
Why It Matters: Returns alone are incomplete. These metrics reveal the risk taken to achieve those returns.
What a Pro Notices:
- Alpha > 0 indicates manager skill
- Information Ratio > 0.5 indicates consistent outperformance
- Sharpe Ratio higher than the category average
- Maximum Drawdown within your emotional tolerance
Section 7: Portfolio Holdings
What to Check:
- Top 10 Holdings: List of largest investments, with percentages
- Sector Allocation: Percentage allocated to each sector (Banking, IT, Pharma, etc.)
- Asset Allocation: Equity vs Debt vs Cash
- Number of Stocks: Total distinct holdings
- Portfolio Turnover Ratio: How frequently the fund buys and sells
Why It Matters: The portfolio reveals the fund’s actual bets and concentration levels.
What a Pro Notices:
- Concentration: If top 10 holdings exceed 50–60%, the fund is concentrated – higher risk, higher potential reward
- Number of Stocks: 40–60 stocks is typical for equity funds; fewer than 30 indicates high concentration; more than 80 may indicate index-like behaviour
- Sector Bets: Overweighting a sector (e.g., 30% in Banking when the index has 25%) is an active bet – understand why
- Portfolio Turnover: >100% means the fund is trading aggressively, incurring higher costs and taxes
Section 8: Expenses & Costs – Updated for SEBI 2026 Framework
What to Check (from April 1, 2026 onwards):
- Base Expense Ratio (BER): The core AMC management fee under the new SEBI 2026 framework. This is what the AMC charges for managing the fund.
- Total Expense Ratio (TER): Now defined as BER + Brokerage + Regulatory levies + Statutory levies (GST, STT, CTT, stamp duty, exchange fees – disclosed separately on actuals)
- Direct vs Regular Plan BER: Direct plan has lower BER (no distributor commission)
- Exit Load: As mentioned earlier
- Performance-linked BER: A new option under SEBI 2026 Regulations; where applicable, the scheme’s BER is partially linked to its performance against a stated benchmark
Why It Matters: Higher costs directly reduce your returns. The new BER framework makes it easier to compare fund management fees across schemes, since statutory levies (which vary by trading activity) are now separated out.
Key Changes Effective April 1, 2026:
- BER caps have been reduced (e.g., Index Funds/ETFs: cap reduced from 1.00% to 0.90% of BER)
- The additional 5 bps allowance for schemes with exit loads has been removed
- Brokerage caps reduced: cash market from 12 bps to 6 bps; derivatives from 5 bps to 2 bps
- GST, STT, CTT, stamp duty, and exchange fees are now charged on actuals, outside the BER cap
What a Pro Notices:
- Compare BER (Direct plan) across similar funds – this is now the most meaningful cost comparison metric
- The illustrative TER ranges that were common before April 2026 (e.g., “large-cap direct plan 0.5–1.0%”) may shift as the new framework beds in – always check the current AMC disclosure
- A fund with performance-linked BER will have variable costs; understand the structure before investing
Section 9: Fund Manager Details
What to Check:
- Name of Fund Manager(s)
- Experience: Total years in the industry
- Tenure with this scheme: How long they’ve managed this fund
- Other schemes managed: May indicate workload
Why It Matters: The fund manager is the key decision-maker. Changes in management can significantly impact performance.
What a Pro Notices:
- Manager tenure > 5 years is a positive sign – they’ve navigated multiple market cycles
- If the manager who built the track record has left, past performance may not repeat
- Managing too many schemes (e.g., 10+) may indicate stretched capacity
Section 10: Additional Disclosures (Enhanced in 2025–2026)
What to Check:
- Portfolio Overlap: SEBI requires monthly disclosure of overlap with other equity schemes of the same AMC (as per the Feb 26, 2026 categorisation circular, Annexure A formula applies quarterly)
- Stress Testing Results: For mid-cap and small-cap funds – shows estimated liquidity resilience (e.g., what % of portfolio can be liquidated within 5 days)
- Scheme-Specific Risks: Concentration risk, sector risk, credit risk for debt funds
- Taxation Summary: Capital gains tax rates (short-term vs long-term)
- SIP/STP Details: Availability and minimum amounts
Why It Matters: These disclosures provide transparency previously unavailable to retail investors.
What a Pro Notices:
- Portfolio Overlap: High overlap (>50%) between two funds you hold means you are not diversifying as much as you think. SEBI’s Feb 2026 circular now caps sectoral/thematic fund overlap at 50% with other equity schemes
- Stress Testing: For small-cap funds, liquidity data like “50% portfolio can be liquidated in 5 days” matters significantly for assessing redemption risk
Section 11: Fund House Information
What to Check:
- Total AUM of the AMC
- Number of schemes managed
Why It Matters: Larger, established fund houses may have stronger research infrastructure, risk management, and stability.
Section 12: Regulatory & Statutory Disclosures
What to Check:
- SEBI Registration Number of AMC
- Trustee company details
- Auditor details
- AMFI-registered Mutual Fund Distributor (if distributed through an MFD)
Why It Matters: These verify the fund’s and distributor’s regulatory standing.
4. Step-by-Step Beginner’s Checklist: How to Read a Factsheet in 10 Minutes
Minute 1–2: Fit Check
| Question | What to Check |
|---|---|
| Does the SEBI category match my investment goal? | Large Cap for core, Mid Cap for growth, etc. |
| Is the Risk-o-Meter within my tolerance? | If “Very High,” can you handle 40–50% drawdowns? |
| Does the investment objective align with my needs? | Growth vs income |
Minute 3–4: Cost Check
| Question | What to Check |
|---|---|
| What is the Direct Plan BER (from April 2026)? | Compare to category peers |
| Is there a performance-linked BER component? | Understand the structure |
| Any exit load? | If you may need liquidity in <1 year, consider carefully |
Minute 5–6: Performance Check
| Question | What to Check |
|---|---|
| How does 3Y and 5Y trailing return compare to benchmark? | Should be consistently higher |
| What about rolling returns? | If disclosed, look for % periods beating benchmark >60% |
| Is performance consistent across periods? | Avoid funds with one great year and otherwise mediocre history |
Minute 7–8: Risk & Portfolio Check
| Question | What to Check |
|---|---|
| Standard Deviation: High or low vs category? | Lower = smoother ride |
| Sharpe/Sortino Ratio: Above category average? | Yes = good risk-adjusted returns |
| Alpha positive? | Yes = manager adds value |
| Maximum Drawdown: Can you tolerate it? | 40% drawdown requires strong stomach |
| Top holdings concentration? | >50% in top 10 = concentrated |
| Number of stocks? | <30 = very concentrated |
Minute 9–10: Manager & Red Flags
| Question | What to Check |
|---|---|
| How long has the manager been running this fund? | >5 years preferred |
| Any recent manager changes? | If yes, past performance may not repeat |
| Any portfolio overlap issues with your existing holdings? | Check the overlap disclosure |
5. Red Flags & Green Flags: What to Watch For
Green Flags (Positive Signs)
| Signal | Why It’s Good |
|---|---|
| Consistent positive Alpha over 5–10 years | Manager skill, not luck |
| Information Ratio > 0.5 | Consistent outperformance |
| Rolling returns beat benchmark >70% of periods | Reliable consistency |
| Manager tenure >7 years | Experience across market cycles |
| Reasonable BER (Direct plan) | Doesn’t eat into returns |
| Portfolio concentration moderate (40–60 stocks) | Diversified but active |
| Low portfolio turnover (<50%) | Cost-efficient |
| Risk-o-Meter matches category and your tolerance | No hidden risk |
Red Flags (Warning Signs)
| Signal | Why It’s Concerning |
|---|---|
| Negative Alpha over 5+ years | Manager underperforms market risk taken |
| Information Ratio < 0 | Consistent underperformance vs benchmark |
| Rolling returns beat benchmark <50% of periods | Active management not adding value |
| High BER without commensurate performance | Paying more for less |
| Frequent manager changes | Unstable investment process |
| Extreme concentration (<20 stocks) | High risk; one bad bet can significantly impact fund |
| Very high AUM in mid/small-cap fund | May limit flexibility |
| Risk-o-Meter “Very High” but you’re conservative | Mismatch with your tolerance |
| Portfolio overlap with existing holdings >50% | Not actually diversifying |
| Exit load when you may need quick liquidity | Not suitable for your situation |
6. How SEBI’s 2025–2026 Rules Changed Factsheet Disclosures
SEBI has significantly enhanced transparency through recent regulations and circulars. Key changes affecting factsheets:
| Rule/Change | Effective | Impact on Factsheet |
|---|---|---|
| SEBI (Mutual Funds) Regulations, 2026 | April 1, 2026 | Replaces 1996 framework; introduces BER structure, cleaner TER definition, performance-linked BER option |
| BER Framework – TER Unbundled | April 1, 2026 | TER = BER + Brokerage + Regulatory levies + Statutory levies. GST, STT, CTT, stamp duty, exchange fees shown on actuals separately |
| Reduced Brokerage Caps | April 1, 2026 | Cash market: 12 bps → 6 bps; Derivatives: 5 bps → 2 bps |
| Exit Load Extra Allowance Removed | April 1, 2026 | The additional 5 bps previously permitted for schemes with exit loads is abolished |
| Reduced BER Caps for Index/ETF | April 1, 2026 | Cap reduced from 1.00% to 0.90% of BER |
| Portfolio Overlap Disclosure | Feb 2026 circular | Monthly disclosure on AMC website; quarterly calculation per SEBI Annexure A formula |
| SEBI Feb 26, 2026 Categorisation Circular | Phased (compliance deadline for existing schemes: 3 years for overlap norms) | Stricter “true-to-label”; 80% equity minimum for Large Cap, Dividend Yield, Value, Contra; sectoral overlap cap at 50% |
| Total Return Index (TRI) Benchmarks | Since 2024 | Equity funds must use TRI (includes dividends) |
| Stress Testing Results | For mid/small-cap | Regular disclosure of liquidity resilience |
| Digital Annual Reports | April 1, 2026 | AMCs must distribute scheme-wise annual reports digitally to unitholders |
What This Means for You: Factsheets are now more transparent than ever. From April 2026, the split between BER and statutory costs will make it much easier to compare fund management fees across schemes on a like-for-like basis.
7. Real-World Example: Reading a Sample Large-Cap Equity Fund Factsheet
The following is a hypothetical and illustrative example only. “ABC Large Cap Fund” is not a real fund. All figures are for educational purposes only.
Let’s walk through a hypothetical factsheet for “ABC Large Cap Fund” (Direct Plan) as of February 2026.
Factsheet Summary (Key Numbers – Illustrative)
| Section | Item | Illustrative Value |
|---|---|---|
| Basic Info | Category | Large Cap Fund |
| AUM | ₹12,500 crore | |
| Risk-o-Meter | Moderate | |
| Benchmark | Nifty 50 TRI | |
| Fund Manager | Ms. Priya Sharma (tenure: 8 years) | |
| Costs | BER (Direct) | 0.85% |
| Exit Load | 1% if redeemed within 365 days | |
| Performance | 1Y Return | 18.2% |
| 3Y Return (CAGR) | 16.5% | |
| 5Y Return (CAGR) | 14.8% | |
| Benchmark 5Y Return | 13.2% | |
| Rolling 5Y % > Benchmark | 78% | |
| Risk Metrics | Standard Deviation | 14.2% |
| Sharpe Ratio | 0.92 | |
| Alpha | +1.2% | |
| Beta | 0.98 | |
| Maximum Drawdown (5Y) | -28% | |
| Portfolio | Top 10 Holdings % | 42% |
| Number of Stocks | 48 | |
| Sector Allocation | Banking 22%, IT 18%, Pharma 10% | |
| Portfolio Turnover | 35% | |
| Manager | Industry Experience | 15 years |
| Tenure with Fund | 8 years |
Step-by-Step Analysis
Minute 1–2 (Fit Check):
- Category Large Cap → suitable for core portfolio
- Risk-o-Meter “Moderate” → aligns with moderate risk tolerance
- Objective “long-term capital appreciation” → matches investment goal
✅ Pass
Minute 3–4 (Cost Check):
- BER 0.85% for direct plan → reasonable for large-cap category
- Exit load 1% → fine for a 5+ year investment horizon
✅ Pass
Minute 5–6 (Performance Check):
- 5Y return 14.8% vs benchmark 13.2% → outperformance
- Rolling returns beat benchmark 78% of periods → excellent consistency
- 3Y and 1Y also beat benchmark → consistent
✅ Pass
Minute 7–8 (Risk & Portfolio Check):
- Standard Deviation 14.2% → moderate for large-cap
- Sharpe Ratio 0.92 → good (illustratively above category average)
- Alpha +1.2% → positive skill
- Maximum Drawdown -28% → manageable for large-cap
- Top 10 holdings 42% → moderate concentration
- 48 stocks → well-diversified
- Turnover 35% → low, cost-efficient
✅ Pass
Minute 9–10 (Manager & Red Flags):
- Manager tenure 8 years → excellent stability
- No recent manager changes
- No red flags identified
✅ Pass
Verdict (Illustrative): This hypothetical fund demonstrates consistent benchmark outperformance, reasonable costs, and experienced management – characteristics worth looking for when evaluating a large-cap fund for core portfolio allocation.
8. Advanced Tips: Going Beyond the Basics Like a Pro
Tip 1: Compare Rolling Returns Across Multiple Periods
Don’t just look at 5-year rolling returns – check 3-year and 1-year rolling as well. A fund that performs consistently across all rolling periods is more reliable than one that only looks good over 5-year windows.
Tip 2: Understand the New BER vs Old TER
From April 1, 2026, fund factsheets will progressively show BER rather than a bundled TER. When comparing older factsheets to newer ones, note that the BER will typically look lower than the old TER figure, because GST, STT, CTT, and similar levies are now excluded from BER. Make sure you’re comparing like with like.
Tip 3: Track Changes Month-on-Month
Save or screenshot factsheets monthly. Compare:
- AUM growth (too fast may impact performance for mid/small-cap funds)
- Portfolio turnover (sudden spike may indicate strategy change)
- Top holdings (concentration increasing?)
- Risk-o-Meter (sudden jump?)
Tip 4: Cross-Reference with SID (Scheme Information Document)
The SID (available on AMC website) contains:
- Detailed investment strategy
- Risk factors
- Fundamental attributes
- Trustee information
Tip 5: Use Peer Comparison Tools
Platforms like Value Research and Morningstar India allow side-by-side factsheet comparison. Look for:
- Consistent outperformance vs category peers
- Lower drawdown than peers
- Better risk-adjusted returns
Tip 6: Understand Portfolio Turnover Implications
| Turnover | Interpretation |
|---|---|
| < 50% | Low; buy-and-hold strategy |
| 50–100% | Moderate; some active trading |
| 100–200% | High; aggressive trading |
| >200% | Very high; may be momentum strategy; watch costs |
Tip 7: Check Credit Quality for Debt/Hybrid Funds
For debt funds, look beyond returns to:
- Average Credit Rating: AAA vs AA vs A – lower rating = higher risk
- Credit Concentration: Exposure to a single issuer >10% is risky
- Duration / Average Maturity: Longer duration = higher interest rate sensitivity
9. Common Mistakes Beginners Make When Reading Factsheets
Mistake 1: Focusing Only on 1-Year Returns
The Error: Choosing a fund because its 1-year return is in the top 10.
Why It’s Wrong: 1-year returns can be driven by luck, sector tailwinds, or concentrated bets that may not repeat.
Correct Approach: Prioritise 3-year, 5-year, and rolling returns.
Mistake 2: Ignoring Direct vs Regular Plan Difference
The Error: Looking at Regular Plan returns and costs, not noticing the Direct Plan.
Why It’s Wrong: Direct Plan has lower BER (no distributor commission), significantly impacting long-term returns.
Correct Approach: Always evaluate Direct Plan numbers when comparing across funds.
Mistake 3: Overlooking the Risk-o-Meter
The Error: Checking only returns, ignoring the risk label.
Why It’s Wrong: A “Very High” risk fund may cause panic selling during corrections.
Correct Approach: Ensure Risk-o-Meter matches your tolerance.
Mistake 4: Not Checking Rolling Returns
The Error: Relying solely on trailing returns.
Why It’s Wrong: Trailing returns depend on a single start date; rolling returns show true consistency.
Correct Approach: Look for rolling return data; if not in the factsheet, find it on Value Research or Morningstar India.
Mistake 5: Chasing Low BER Without Looking at Performance
The Error: Choosing the fund with the lowest BER regardless of returns.
Why It’s Wrong: A low-cost fund that underperforms by 2% annually is worse than a slightly higher-cost fund that outperforms by 1.5%.
Correct Approach: Balance cost with performance consistency.
Mistake 6: Ignoring Portfolio Concentration
The Error: Not checking how many stocks the fund holds.
Why It’s Wrong: A fund with 20 stocks is highly concentrated – one bad stock can significantly impact returns.
Correct Approach: Understand concentration and ensure it matches your risk tolerance.
Mistake 7: Not Checking Manager Tenure
The Error: Investing based on past performance without checking if the manager who generated it is still there.
Why It’s Wrong: A new manager may have a different style and may not repeat past performance.
Correct Approach: Verify manager tenure >5 years, or understand why the change occurred.
Mistake 8: Ignoring Portfolio Overlap Across Funds
The Error: Investing in multiple funds without checking if they hold the same stocks.
Why It’s Wrong: You may think you’re diversified, but high overlap means you’re concentrated in the same stocks.
Correct Approach: Check the portfolio overlap disclosure (now mandatory on AMC websites under SEBI’s Feb 2026 circular) or use comparison tools.
Mistake 9: Misunderstanding NAV
The Error: Thinking a fund with a lower NAV is “cheaper” or “better value.”
Why It’s Wrong: NAV is irrelevant for comparing funds. A ₹100 NAV fund and a ₹20 NAV fund are just different prices per unit.
Correct Approach: Ignore NAV; focus on returns, risk, and costs.
Mistake 10: Confusing Old TER with New BER
The Error: Comparing a fund’s 2025 TER (bundled) with a 2026 BER (unbundled) figure and concluding costs have fallen dramatically.
Why It’s Wrong: BER excludes GST, STT, stamp duty, and other levies. The total cost to the investor (TER = BER + levies) may not have changed as dramatically as the headline BER figure suggests.
Correct Approach: When comparing costs pre- and post-April 2026, use the full TER breakdown, not just BER.
10. Practical Framework: Your Monthly Factsheet Review Routine
Monthly/Quarterly Review (5–10 minutes)
| Step | Action |
|---|---|
| 1 | Check Manager: Still the same? Any change in last 3 months? |
| 2 | Check BER/TER: Any increase? Is it still reasonable? |
| 3 | Check AUM: Sudden large inflow/outflow? |
| 4 | Check Top Holdings: Any new major positions? Any red flags? |
| 5 | Check Risk-o-Meter: Any change from last month? |
Annual Deep Dive (15–20 minutes)
| Step | Action |
|---|---|
| 1 | Full checklist (10-minute checklist above) |
| 2 | Compare to peers: Is fund still in top quartile? |
| 3 | Review rolling returns: Has consistency declined? |
| 4 | Check portfolio turnover: Has it increased significantly? |
| 5 | Review manager: Still tenure >5 years? |
| 6 | Re-assess fit: Still matches your goal and risk tolerance? |
| 7 | Check portfolio overlap: Has overlap with your other holdings increased? |
When to Consider Replacing a Fund
| Condition | Suggested Action |
|---|---|
| Alpha negative for 2+ years | Consider replacement |
| Rolling returns beat benchmark <50% for 2+ years | Consider replacement |
| Manager change without proven successor | Monitor; consider replacing |
| BER increased significantly without performance improvement | Re-evaluate |
| Portfolio concentration increased beyond your tolerance | Re-evaluate |
| Risk-o-Meter moved to a level beyond your tolerance | Consider replacement or reduced allocation |
11. Comprehensive FAQ Section (25+ Questions)
Q1: What is the most important number in a factsheet?
There is no single most important number. A combination matters: Alpha (skill), rolling returns (consistency), BER (cost), and maximum drawdown (risk tolerance). Returns alone are incomplete.
Q2: How do I compare two funds using factsheets?
Compare within the same SEBI category: 5Y rolling returns, % periods beating benchmark, Alpha, Sharpe Ratio, BER (Direct Plan), and manager tenure.
Q3: What is Base Expense Ratio (BER)?
Introduced under the SEBI (Mutual Funds) Regulations, 2026 (effective April 1, 2026), BER is the core management fee charged by the AMC. Statutory levies (GST, STT, CTT, stamp duty, exchange fees) and brokerage are now disclosed separately, making the TER = BER + Brokerage + Statutory levies.
Q4: Why check rolling returns instead of trailing returns?
Rolling returns remove start-date bias and show consistency. A fund may look excellent on trailing returns but have poor rolling returns if one exceptional period is distorting the picture.
Q5: What does a high portfolio turnover ratio indicate?
The fund trades frequently, which increases transaction costs and taxes. This may be appropriate for certain strategies but should be understood before investing.
Q6: What is a reasonable BER for a large-cap fund (Direct Plan) from April 2026?
Under the new SEBI 2026 framework, BER caps for equity funds are AUM-linked and lower than old TER caps. Check current AMC disclosures for actual BER figures – old TER benchmarks are not directly comparable. For index funds and ETFs, the BER cap has been reduced to 0.90%.
Q7: What is a reasonable BER for a mid-cap fund (Direct Plan)?
BER caps are AUM-dependent under SEBI 2026. Higher AUM funds face lower caps (economies of scale principle). Always check current disclosures; old TER ranges are no longer the right benchmark.
Q8: Should I worry about NAV?
No. NAV is just the price per unit. A fund with NAV ₹20 is not “cheaper” than one with NAV ₹200.
Q9: How do I find the factsheet for a fund?
AMC website, AMFI India (amfiindia.com), Value Research, Morningstar India, or MF Utility.
Q10: What does “Risk-o-Meter” actually measure?
It measures the fund’s risk level based on its actual portfolio holdings, updated whenever there are material changes.
Q11: What is the difference between Growth and IDCW options?
Growth: returns are reinvested, NAV increases. IDCW (Income Distribution cum Capital Withdrawal, formerly “dividend”): profits are distributed, NAV falls by the distribution amount. Note that IDCW distributions attract tax at your applicable income tax slab.
Q12: Why is there a separate Direct Plan?
Direct Plan has no distributor commission, so a lower BER. Available for investors investing directly with the AMC or through distributors.
Q13: What is Maximum Drawdown and why does it matter?
It’s the worst peak-to-trough loss in the period shown. It tells you what you might have experienced in a worst-case scenario – critical for assessing your emotional tolerance for risk.
Q14: How much concentration in top holdings is acceptable?
For large-cap: 40–50% in top 10 is moderate. For mid/small-cap: 30–40% is moderate. >60% is highly concentrated and increases single-stock risk.
Q15: What does a high Sharpe Ratio mean?
Higher return per unit of total risk. Generally desirable.
Q16: What does a high Sortino Ratio mean?
Higher return per unit of downside risk (the “bad” volatility). Particularly useful for conservative investors comparing downside risk.
Q17: What does negative Alpha mean?
The manager underperformed relative to the market risk taken. This is a warning sign, especially if persistent over 3–5 years.
Q18: What does Beta >1 mean?
The fund amplifies market moves. In a rising market it may outperform; in a falling market it typically falls more than the index.
Q19: How often are factsheets updated?
Monthly for equity funds; quarterly for some debt funds. AMCs must now distribute annual reports digitally to unitholders under SEBI 2026 regulations.
Q20: Can I rely solely on star ratings instead of factsheets?
No. Star ratings are backward-looking and can lag changes in manager, strategy, or fund size. Factsheets give the full, current picture.
Q21: What is portfolio overlap and why does it matter?
It shows how much two funds from the same AMC share common holdings. High overlap means you’re not diversifying as effectively as you think. Now mandatorily disclosed monthly on AMC websites.
Q22: How do I check if a fund is “true to label”?
Check its SEBI category and portfolio. A large-cap fund must now have ≥80% in large-cap stocks (top 100 companies by market capitalisation). If the portfolio deviates, it’s a compliance concern.
Q23: What should I look for in a debt fund factsheet?
Credit quality (AAA vs AA), duration, yield-to-maturity, average maturity, and credit concentration.
Q24: What is the difference between a factsheet and SID?
Factsheet is the monthly/quarterly summary. SID (Scheme Information Document) is the detailed legal document containing the investment strategy, risks, and fundamental attributes – a more comprehensive reference document.
Q25: How do I know if a fund is suitable for my situation?
Match the category (large-cap for core, mid-cap for growth), risk level (Risk-o-Meter), and your investment horizon. For personalised guidance, consult an AMFI-registered Mutual Fund Distributor.
Q26: What changed in expense disclosures after April 1, 2026?
Under SEBI (Mutual Funds) Regulations, 2026, the TER framework has been unbundled. TER = BER + Brokerage + Regulatory levies + Statutory levies. GST, STT, CTT, stamp duty, and exchange fees are now shown separately on actuals. BER caps have been reduced for certain categories. The additional 5 bps exit load allowance has been removed.
12. The Bottom Line: Turn Factsheets into Your Superpower
Learning to read a mutual fund factsheet like a pro takes the guesswork out of investing. Instead of relying on advertisements, star ratings, or word-of-mouth, you make decisions based on facts, consistency, costs, and alignment with your goals.
Key Takeaways
| Concept | Key Insight |
|---|---|
| Fit Check | Ensure category and risk match your profile |
| Cost Check | BER matters; Direct Plan is cheaper than Regular Plan |
| Performance | Look at rolling returns, not just trailing; check consistency |
| Risk | Check Standard Deviation, Drawdown, Risk-o-Meter |
| Portfolio | Understand concentration, sector bets, turnover |
| Manager | Tenure matters; changes require scrutiny |
| Red Flags | Negative Alpha, high BER, excessive concentration, frequent manager changes |
| 2026 Changes | TER is now unbundled; BER is the new core cost metric from April 1, 2026 |
Your 10-Minute Checklist Summary
| Minute | Focus |
|---|---|
| 1–2 | Fit (Category, Risk-o-Meter, Objective) |
| 3–4 | Cost (BER, Exit Load) |
| 5–6 | Performance (3Y/5Y returns, rolling, vs benchmark) |
| 7–8 | Risk & Portfolio (Sharpe, Alpha, Drawdown, Holdings) |
| 9–10 | Manager & Red Flags |
Start with the 10-minute checklist today. Over time, you’ll develop the confidence to evaluate any scheme independently. The best investors don’t chase hot funds – they read factsheets carefully and choose funds they truly understand.
13. Contact & Distribution Services
For questions about mutual fund scheme features or distribution assistance as an AMFI-registered Mutual Fund Distributor:
📱 Call/WhatsApp: +91-76510-32666 🌐 Visit: mfd.co.in/signup 📧 Email: planwithmfd@gmail.com
AMFI-registered Mutual Fund Distributor | ARN-349400
Mutual fund distribution services only. I am an AMFI-registered Mutual Fund Distributor – NOT a SEBI-registered Investment Adviser. I do not provide financial planning, investment advisory, or portfolio management services. All investment decisions are your own responsibility. Please read all scheme-related documents carefully before investing.
14. Regulatory Disclosure
🚨 MANDATORY DISCLAIMER
This content is for educational and informational purposes only. Mutual fund investments are subject to market risks, including the risk of loss of principal. This is NOT investment advice, a recommendation to buy or sell any specific fund, or a guarantee of future performance. Past performance is not indicative of future results.
All figures, examples, and fund details in this article are hypothetical and illustrative only. They do not represent any real fund’s actual data.
Factsheets should be evaluated alongside your complete financial situation, goals, and risk tolerance. Always consult a SEBI-registered investment adviser or AMFI-registered mutual fund distributor for personalised guidance.
AMFI-registered Mutual Fund Distributor | ARN-349400 (verify at amfiindia.com)
I am an AMFI-registered Mutual Fund Distributor – NOT a SEBI-registered Investment Adviser.
Mutual Fund investments are subject to market risks. Read all scheme-related documents carefully before investing.